Your inventory management dashboard says stock is fine. Read it again.
Fast turns and a lean stock number can hide a mix problem. What each measure means, what to do about it and how to make the page repeatable.
Fast turns and a lean stock number can hide a mix problem. What each measure means, what to do about it and how to make the page repeatable.
Inventory is where cash, service and margin meet. Carry too much and cash sits on the shelf, the warehouse fills up and some of it ends up written off. Carry too little and orders ship late, the plant changes over to chase shortages and freight gets expensive. Most businesses are doing both at once, on different lines.
The dashboard below is built to show which way the business is leaning. Too much stock shows up as stock turns falling below target, days of cover climbing and the write-off provision (stock you expect to throw away or sell at a loss) rising as a share of stock. Too little shows up as turns running well above target and inbound supply falling behind cost of goods sold. Stock split by class shows where it is happening: finished goods, semi-finished goods or raw materials. Payables by age show the other half of the cash story.
None of that helps unless it is repeatable. Open the page next month and the definitions have not moved and the result is already there. Nobody exports a file, refreshes a pack or pastes the month into a chat to present it.
Are we holding the right amount of stock? Stock turns and days of cover answer this, read against a target the business has set. When turns drift below target, stock is building faster than sales are using it and cash is going with it. The usual response is to cut reorder quantities, slow purchasing on lines that are not moving and challenge minimum order quantities. When turns run well above target, the risk flips to stockouts. Buffers on critical lines may need to go up.
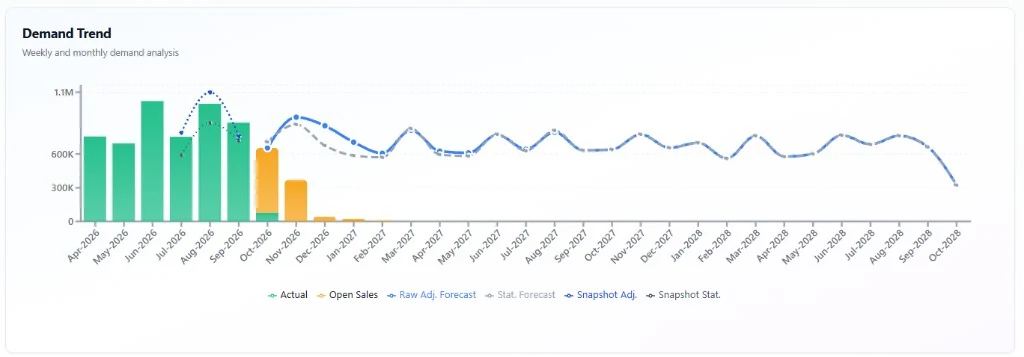
Is supply keeping up? Inbound supply sits beside cost of goods sold. Both are at cost, so the gap between them is the change in stock for the month. Stock is split into finished goods, semi-finished goods and raw materials, because a healthy total can hide a raw material that is running down. A month of inbound falling behind cost of goods sold is an early warning. It leaves time to expedite a purchase order, move a run or warn a customer. Finding out on the day means overtime, premium freight or a missed delivery. Whether supply will cover the next runs is a forward question. That is where history runs out.
Is cash tied up where it should not be? The write-off provision, as a share of stock, shows how much of the shelf is unlikely to sell. A rising line is the cue to discount, rework or stop buying those items before the loss is booked. Payables split by age show the other side of working capital. Invoices past 90 days put supplier goodwill and credit terms at risk, even when the total looks reasonable.
Take one month from the sample: cost of goods sold of 5,580, stock on hand of 5,507 and a write-off provision of 661.
| Measure | Calculation | Result | Target |
|---|---|---|---|
| Stock turns, a year | 5,580 × 12 ÷ 5,507 | 12.2 | 6 |
| The same, as days of cover | 5,507 ÷ 5,580 × 30 | 30 | 60 |
| Write-off provision | 661 ÷ 5,507 | 12% | 7% |
Each number on its own invites the wrong response. Turning stock twice as fast as target, with about 30 days of cover instead of 60, looks like a win. Put it beside the write-off provision and it says something else. Stock is moving quickly overall, yet close to double the target is expected to be written off. That is a mix problem, not a volume problem. Some lines are running too lean while others age on the shelf. The answer is not to buy less across the board. It is to find the slow lines by class, stop replenishing them and protect cover on the lines that sell.
Notice that turns and days of cover moved together. They are the same measure seen from two sides. Days of cover is roughly 360 divided by turns, so 6 turns a year is about 60 days and 12 turns is about 30. Pick one as the target and the other follows. The dashboard links the two for that reason.
The cards show the latest finished month and the charts show the twelve months up to it. Pick a month and type over the white numbers. The charts update as you go and you can hover over any bar or point for its value. The sample adds up: a month's stock on hand, less its cost of goods sold, plus its inbound supply, gives the next month's stock on hand. Edits change only the month you are on. Nothing is saved and refreshing the page resets it.
Clear cost of goods sold and the turns line goes blank instead of breaking. That blank is deliberate. A spreadsheet error tells you a formula failed. A blank tells you a number is missing, which is the thing you actually need to chase.
A page like this reports history. It tells you whether stock moved, whether supply covered the run and whether cash got stuck. It cannot tell you what to buy or make next month. That needs a plan.
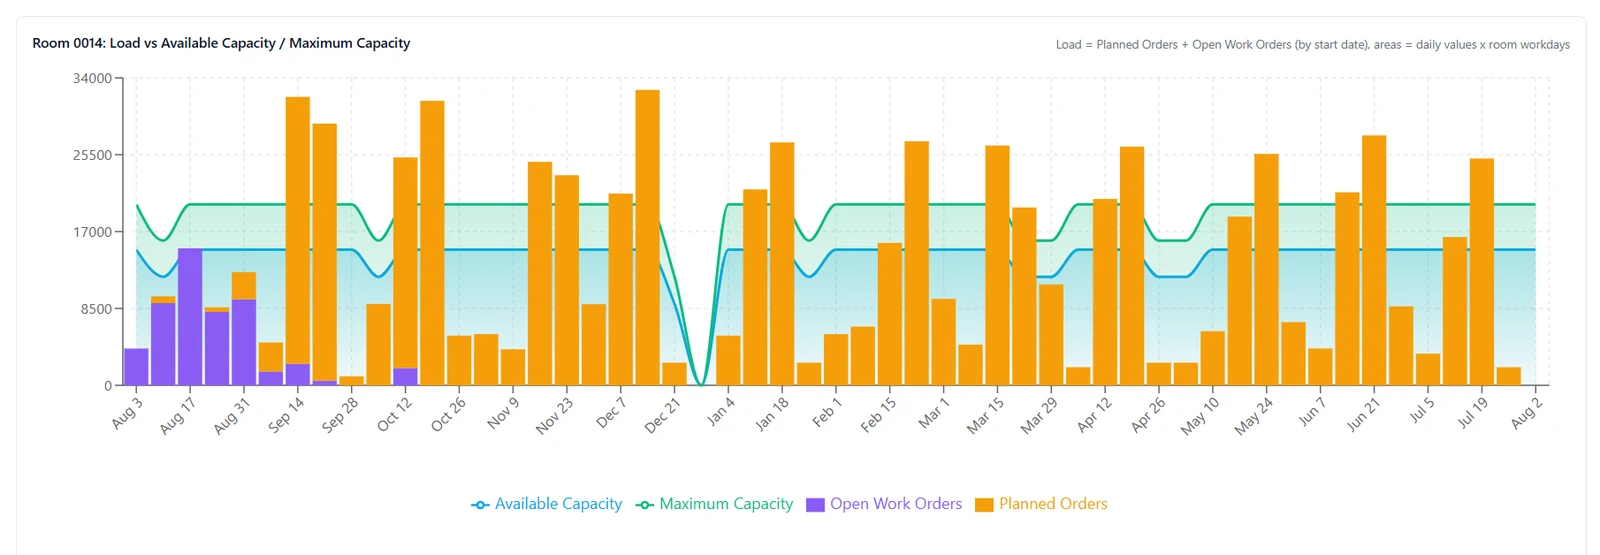
Our Integrated Planning Platform is the system we built for that job. It sits on your ERP and looks forward: expected demand, what to buy and make, how much stock to hold and the shortages coming while there is still time to act. Read how it works.
Sales, cost of goods sold, stock on hand, inbound supply, stock turns, days of inventory and how old the payables are. The point is whether stock is moving, whether supply is keeping up and whether cash is stuck in stock or in unpaid invoices.
For one month, stock turns are cost of goods sold divided by stock on hand, times 12, so the result is an annual rate. Days of inventory are stock on hand divided by cost of goods sold, times the days in that month. They are the same measure from two sides: 6 turns a year is about 60 days of cover. If either input is missing, leave the result blank.
The same definitions, every time, calculated from the source and presented without anyone assembling the pack. A refreshed sheet or a one-off chart can be useful once. It is not the page the team reads next month.
Book a consultation and we will look at the inventory view you have and the one the planner can act on.